What does it do?
The Fourier transform decomposes a waveform or signal into its constituent sinusoidal waves of different frequencies, amplitudes, and phases. It essentially breaks down a complicated waveform into a sum of simpler sine and cosine waves. Otherwise known as seeing it in the frequency-domain.
Look at this image here: It’s actually made up of a bunch of waves stacked on top of each other. All waves are like this.
In the image, we’re seeing the strength or power of each frequency that makes up the input wave.
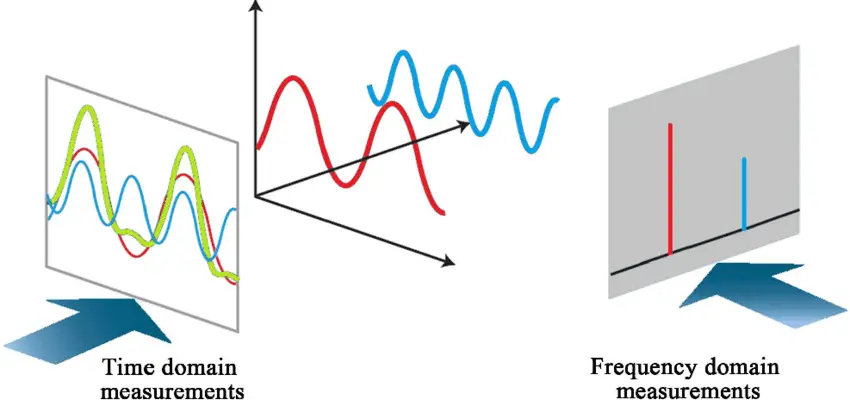
This is said to be the frequency domain representation of the original function (the final graph in blue). We get no information about the change over time when looking at the frequency domain representation, instead we get the power levels (strength of amplitude) of each frequency component present. This is the frequency domain representation as opposed to the time domain representation, where the value of the wave is known at all real possible values of time (the graph in red).
Put simply, a time-domain graph shows how a signal changes over time, whereas a frequency-domain graph shows how the signal is distributed within different frequency bands over a range of frequencies.
This ties into the Uncertainty principle, which basically states that the more you know about frequency, the less you know about time(as in when it takes place), and vice versa. This is why in the case of a Fourier transformation, we can know everything about the waves that make up the input function with 100% certainty, we cannot know anything about when these are in effect.
On the other hand, when looking at the time domain representation, we know the exact value of the function at all times, but we don’t know anything about the waves that make it up. This is the input to the Fourier transform.
The time domain and frequency domain representations are complementary views of the same signal. They contain the same information, just represented differently. The Fourier transform allows us to switch between these two representations
An Example - How does it work?
The input of a Fourier transform will be denoted as , and the output will be denoted as .
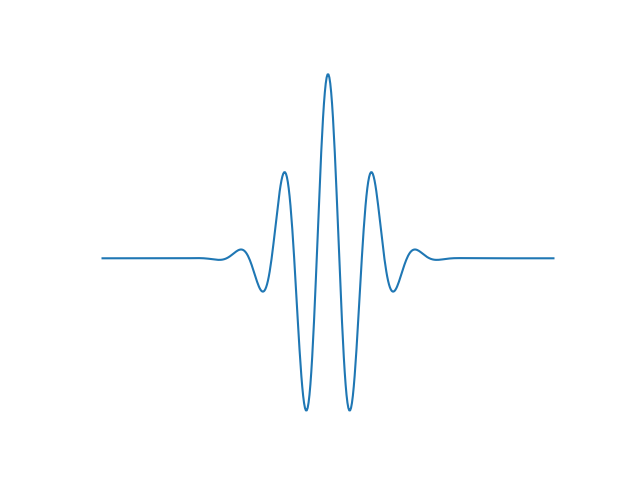
The function above is . It is a cosine wave that oscillates at 3Hz (assuming t is seconds) and tends quickly to 0. (The second factor in this equation is an envelope function shown in red that shapes the continuous sinusoid into a short pulse.) - Fourier transform - Wikiwand
The result will be denoted as . In order to calculate it, we need to integrate the result(product) of . Why is this?
is another notation for
Where comes from and Euler’s formula
is a complex exponential which is oscillating. This oscillation comes from the item.
can be expressed as . This is Euler’s formula, which states that . This represents a complex sinusoid oscillating at 3 Hz. The cosine(real) and the sine(imaginary ) component are 90 degrees out of phase.
It kinds of look like this:


To reiterate: . The imaginary component(sin) is 90 degrees out of phase from the real component(cos).
The coefficient of t in this case is 3 because that’s the frequency we’re trying to extract at the moment, which will give us the result of . In general, the frequency term in the complex exponential used in the Fourier transform integral is chosen to match the frequency k present. This means we will slide k here to find out the power level of the contributing wave at frequency k.
Real and imaginary parts - How it really works
The wikipedia page states it best:

The 2 images on the right are the real and imaginary parts of that product respectively. The real part of the integrand has a non-negative average value, because the alternating signs of and oscillate at the same rate and same phase, whereas and are same rate but orthogonal(90 degrees offset) phase. The result is that when you integrate the real part of the integrand you get a relatively large number (in this case 1/2)
When you try to measure a frequency that is not present, as in the case when we look at both real and imaginary component of the product vary rapidly between positive and negative values. Therefore, the integral is very small and the value for the Fourier transform for that frequency is nearly zero. The general situation is usually more complicated than this, but heuristically this is how the Fourier transform measures how much of an individual frequency is present in a function.
So how does taking the integral compare its alikeness?
- It is important to note that we are multiplying by . This product will be large (constructively added) at times when and are “in phase” and have the same sign. It will be small (destructively canceled) when they are “out of phase” and have opposite signs.
- If and contains much of the same frequency, their product will consistently have the same sign, allowing the areas under the curve to constructively add up.
- The inverse is also true. If they are not well matched, their product will rapidly oscillate between positive and negative values, causing the areas under the curve to cancel out.
- By integrating this product over all time, we are essentially summing up the total area under the curve that didn’t get canceled out due to sign mismatches.
As the product is complex, the result of the Fourier transform integral for a given frequency k can be represented as a complex number, which will be in the form . This can also be thought of as the Dot product between the complex and the real or complex value at , which is another way to think of the Fourier Transformation that I will not get into at this moment.
Extracting phase and magnitude
From the form , we can take the absolute value of the complex number, otherwise known as the magnitude, which is given by the equation .
Note that we are taking the coefficient of the imaginary component here, which will be a real number. This means the magnitude will also be a real number.
The phase is encoded by the angle from 0 that the line pointing to the point in the complex plane is. In other words, angle , which is the phase component in the equation , can be given by the following:

It is with this phase information that the make up of a wave at frequency k can be perfectly encoded, allowing for a perfect reconstruction of the input function, allowing for a perfect conversion between the time-domain and the frequency-domain representations
In summary, it is taking the frequency k and then comparing how alike it is to the input function, for sliding frequency of k.
The result
Here is the result. Isn’t it beautiful? But why is there a response at -3 Hz?
This is due to the fact that is indistinguishable from .
On symmetry: The reason for the response at -3 Hz is that the Fourier transform is a symmetric operation, and the Fourier transform of a real-valued function is conjugate-symmetric (or Hermitian-symmetric). This means that the Fourier transform at a positive frequency is the complex conjugate of the Fourier transform at the corresponding negative frequency.
Error in notation: denoting the result as is probably wrong. It should be , as the result is a function of frequency, not time.
Sources
Why did I write this?
Thanks for reading! Although this is a very well explained topic I couldn’t really understand it for a while. Writing this is more for my own understanding than for the reader tbh, I did learn a lot by writing this.